When errors occur in your Elastic Beanstalk environment, the root cause may not always be obvious. In the browser, you may get a 502 Bad Gateway error or an error like:
An unhandled lowlevel error occured. The application logs may have details.
Not very helpful.
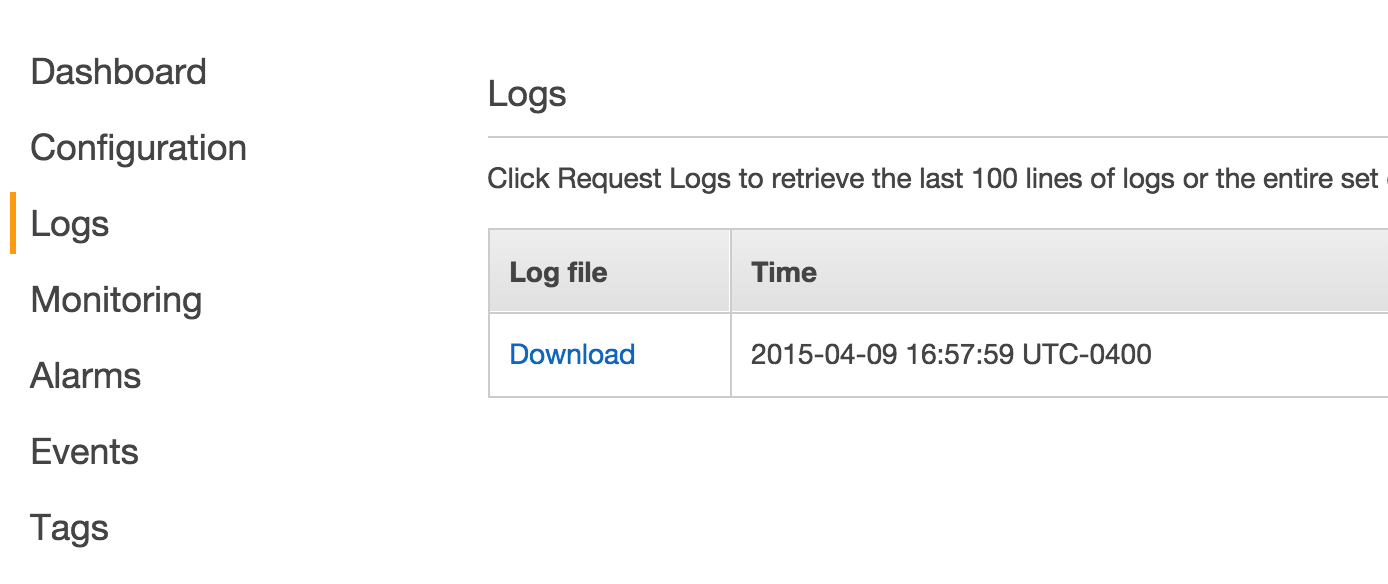
In order to troubleshoot and diagnose the problem, you may have to resort to inspecting the Elastic Beanstalk log files. There are a couple of ways to do so. First, you can use the Elastic Beanstalk Management Console to download a zip archive of the logs. You can request the full logs or just the last 100 lines.
This process is a bit cumbersome, in my opinion. I prefer to use the eb
command line tool to view the logs in my shell. If you don’t have the EB CLI
tool, you can find instructions on how to install it
here.
All you need to do to view your logs is run the eb logs command. If you have
more than one environment, you can specify it as an option. For example, to view
the logs in my development environment, I simply run:
$ eb logs developmentAfter a few moments, it will output the logs to the terminal and I can easily
page through them. By default, it will return the last 100 lines of logs but you
can request them all with (no surprise) the --all option. Usually, I find that
the first 100 lines will let me track down the problem, whatever it might be.
Note that you must run the eb logs command from an already initialized Elastic
Beanstalk project directory.
