In version 1.12, Docker added the ability to perform health checks directly in the Docker engine — without needing external monitoring tools or sidecar containers. Built so that the new Swarm mode orchestration layer can reschedule unhealthy containers or remove them from the load balancer pool, health checks can also be used outside of Swarm mode.
You can use the new HEALTHCHECK instruction to add health checks to custom images. But, you can also add a health check when running containers from existing images that might not have one built-in. As an example, let’s see how we can include a health check when we run a container from the Elasticsearch image.
$ docker run --rm -it \
         --name=elasticsearch \
         --health-cmd="curl --silent --fail localhost:9200/_cluster/health || exit 1" \
         --health-interval=5s \
         --health-retries=12 \
         --health-timeout=2s \
         elasticsearch
The health check related options are:
- health-cmd: this defines what command to run in order to check the health
status. Health check commands should return
0if healthy and1if unhealthy. Note that the command you use to validate health must be present in the image. In this example, we are usingcurlto check the built-in Elasticsearch health endpoint. - health-interval: this controls the initial delay before the first health check runs and then how often the health check command is executed thereafter. The default is 30 seconds.
- health-retries: the health check will retry up to this many times before marking the container as unhealthy. The default is 3 retries.
- health-timeout: if the health check command takes longer than this to complete, it will be considered a failure. The default timeout is 30 seconds.
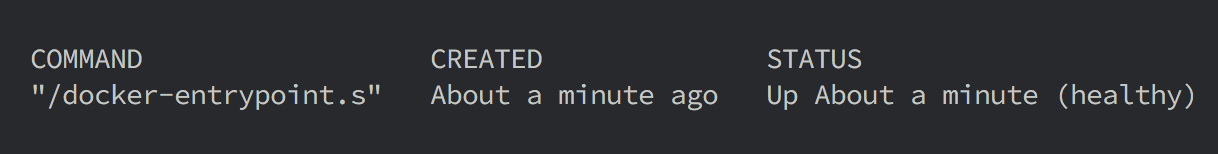
Once you start the container, you will be able to see the health status in the
docker ps output.
$ docker ps
CONTAINER ID        IMAGE               COMMAND                  CREATED             STATUS                             PORTS                NAMES
737fc159e3bf        elasticsearch       "/docker-entrypoint.s"   17 seconds ago      Up 15 seconds (health: starting)   9200/tcp, 9300/tcp   elasticsearch

$ docker ps
CONTAINER ID        IMAGE               COMMAND                  CREATED             STATUS                    PORTS                NAMES
737fc159e3bf        elasticsearch       "/docker-entrypoint.s"   50 seconds ago      Up 49 seconds (healthy)   9200/tcp, 9300/tcp   elasticsearch
The health status is available from the
Docker API
and using the docker inspect command.
The following commands use the fantastic jq
tool. Make sure you have it installed
if you are following along. You can do similar things
using
docker inspect --format but
it is a little more unwieldy.
$ docker inspect elasticsearch | jq ".[].State.Health"
{
  "Status": "healthy",
  "FailingStreak": 0,
  "Log": [
    {
      "Start": "2016-09-22T23:56:33.192710692Z",
      "End": "2016-09-22T23:56:33.294607324Z",
      "ExitCode": 0,
      "Output": "{\"cluster_name\":\"elasticsearch\",\"status\":\"green\",\"timed_out\":false,\"number_of_nodes\":1,\"number_of_data_nodes\":1,\"active_primary_shards\":0,\"active_shards\":0,\"relocating_shards\":0,\"initializing_shards\":0,\"unassigned_shards\":0,\"delayed_unassigned_shards\":0,\"number_of_pending_tasks\":0,\"number_of_in_flight_fetch\":0,\"task_max_waiting_in_queue_millis\":0,\"active_shards_percent_as_number\":100.0}"
    }
  ]
}
As you can see, you can see the current Status, FailingStreak, and a log of
the last 5 health check command results. If you just want to report the status,
you could run:
$ docker inspect elasticsearch | jq -r ".[].State.Health.Status"
healthy
Of course, you can write scripts or custom tools to periodically check the health status of your containers and react accordingly. Also, a docker event is generated when the health status of a container changes so you also have the ability to respond immediately if you are consuming the docker event stream.
As mentioned above, you can also bake a health check into a custom image by
using the HEALTHCHECK instruction in your Dockerfile:
FROM elasticsearch:2.4.0

HEALTHCHECK --interval=5s --timeout=2s --retries=12 \
  CMD curl --silent --fail localhost:9200/_cluster/health || exit 1
Now you can build and run the image with the built-in health check:
$ docker build -t elasticsearch-health .
Sending build context to Docker daemon 2.048 kB
Step 1 : FROM elasticsearch:2.4.0
 ---> e8413094f5d5
Step 2 : HEALTHCHECK --interval=5s --timeout=2s --retries=12 CMD curl --silent --fail localhost:9200/_cluster/health || exit 1
 ---> Using cache
 ---> 6dd547a8c5df
Successfully built 6dd547a8c5df

$ docker run -d --name=elasticsearch elasticsearch-health
501e5714e95c371d53bcb1a091ae621f398ae48774ba5b54b3fac7ae0e59192a

$ docker ps
CONTAINER ID        IMAGE                  COMMAND                  CREATED             STATUS                    PORTS                NAMES
501e5714e95c        elasticsearch-health   "/docker-entrypoint.s"   17 seconds ago      Up 16 seconds (healthy)   9200/tcp, 9300/tcp   elasticsearch
For more options, see the HEALTHCHECK instruction documentation.